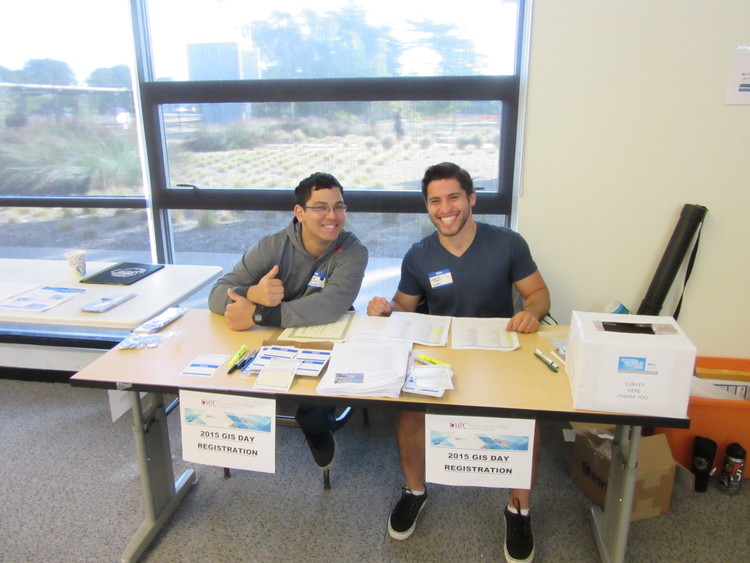
Join us for GIS Day 2016
Registration open until Oct.31st extended to Nov. 11th
Online registration is now closed. Same-day registration will be available on-site.
What is GIS Day?
GIS Day is an annual, grass-roots, event celebrated by GIS users around the world. CCJDC is proud to host GIS Day for the central coast, providing a space for the local GIS community to share, collaborate, network, and learn more about GIS.
Schedule Available Here
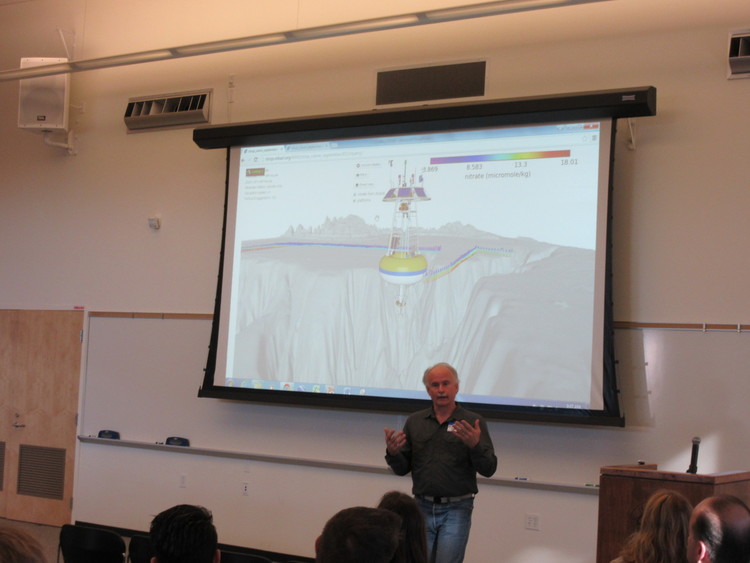
KEYNOTE PRESENTATIONS
Printable Agenda (updated 2016-11-15)
GIS And Mapping For Air Resources Management
David Frisbey - Monterey Bay Air Resources District
The Monterey Bay Air Resources District is the regional agency responsible for implementing Federal, State and local air quality regulations. This presentation is a survey of our varied uses of GIS in support of air resources management programs such as rule making, regulatory enforcement, permitting, and air quality forecasting.
Building The 2016 Monterey County Bicycle Map
Virginia Murillo - Transportation Agency for Monterey County
Virginia Murillo will go over the technical process and lessons learned about building the 2016 Monterey County Bicycle Map. The 2016 Monterey County Bike Map shows the location of bike paths, lanes and routes in all of the cities of Monterey County. The bike map also shows unofficial bike routes, cross-county bike routes, regional bike routes and some unpaved trails. Uphill bikeways are also identified. The bike map is intended to serve as a guide for residents and visitors planning to explore Monterey County by bike.
The bike map was updated using ArcMap 10.3, the ArcGIS Spatial Analyst extension, and formatted for publication using Adobe Illustrator and Adobe InDesign.
Experiencing Data Through Story Maps
Mimi D'Iorio - National Oceanic and Atmospheric Administration
This presentation will focus on the application of ESRI's Story Map tools to strengthen the reach and impact of spatial data and maps. It will explore a variety of published NOAA Story Maps and show how these online communication tools promote new ways to connect with data by integrating multi-media content to create interactive and memorable user experiences.
Of Puma And People - The Physiology And Ecology Of A Predator In A Human-Dominated World
Barry Nickel - Center for Integrated Spatial Research, University of California Santa Cruz
Understanding the impacts of anthropogenic activities on the responses of wildlife is an important component to their effective conservation and management. For large mammalian carnivores, persistent and concurrent human threats such as the loss and fragmentation of habitat, direct persecution, and loss of prey base have contributed to major declines in population sizes and geographic ranges of many species. However several species of large carnivores, like the puma, are seemingly adaptable to living in human dominated landscapes, yet little is known about the fitness consequences of persistent exposure to humans and products of human activity (e.g. disturbance) in such species. This talk will highlight how spatial technology is being leveraged to better understand how disturbance and risk plays a role in modulating the ecology of pumas inhabiting a human-dominated landscape. Understanding how perceived risk influences both puma and human behavior should provide new insights regarding human-caused disturbance of wildlife and demonstrate the importance of understanding the interactions between predators and people when developing conservation plans.
Large-Scale Electric Transmission Vegetation Threat Analysis Using Photogrammetric Point Clouds
Aaron Cole - Center for Integrated Spatial Research, UCSC & InspecTools
There are more than 200,000 miles of high-voltage overhead electric transmission lines in the United States. To stay in compliance with federal regulations, utility companies are required to undertake massive vegetation management programs along their rights of way, estimated to cost anywhere between $2 and $3 billion annually. The industry has increasingly turned toward LiDAR-based analysis to identify dangerous trees and encroaching vegetation. Though effective, LiDAR data is costly to acquire and time-consuming to process, diminishing budgets allocated for both threat inspection and remediation. The results from a pilot project in the Southeastern US have shown that photogrammetric point clouds can successfully be used in place of LiDAR as a lower cost alternative data acquisition method for large-scale electric transmission vegetation threat analysis.
Mapping the Electorate in Monterey County
Chuck Cassinelli
GIS Mapping For Post-Fire Erosion Control Using GIS Data From CalFire, USGS, And Digital Globe
John J. Schweisinger - Turf Image, Inc.
This project used the Monterey Regional Park District (MPRPD) Geographic Information System (GIS) to map and define the damage associated with the Soberanes Fire. The MPRPD GIS was overlaid to map the impact of the fire footprint and the fire lines used to control the wildfire. The MPRPD GIS was used to display and analyze the damage associated with the Soberanes fire by using the GIS data provided by CalFire. The MPRPD GIS, the Palo Corona General Development Plan (PCRP GDP GIS) and the CalFIre GIS (CalFire GIS) were used to estimate total damage by the Soberanes Fire during the summer of 2016.
Santa Cruz And Monterey County Sea Level Rise Adaptation And Planning Project
Jason Adelaars, Sarah Stoner-Duncan, Ross Clark, Sierra Tobin - Central Coast Wetlands Group
Current projections of climate change induced sea level rise around the Monterey Bay area suggests broad socioeconomic and environmental impacts to coastal cliffs and dunes, as well as agricultural land and developed tourist centers. To evaluate and quantify these potential impacts the Central Coast Wetlands Group and partners collaborated on a regional GIS analysis that incorporated land-use, infrastructure, building footprints, agricultural land, etc; along with extents of predicted cliff erosion, dune erosion, tidal inundation, and coastal & fluvial flooding at 2030, 2060, and 2100 time horizons. In an effort to reproduce results and refine the methods throughout the project, we used Python geoprocessing techniques to rapidly evaluate input layers and calculate summary statistics by jurisdiction. The results will be disseminated to local planning agencies to inform their Local Coastal Plans and other planning documents. The subject of this talk will be to present the input layers and analysis methods; and display some results to the group.
Ground Truth: Making Google Maps
Megan Goddard - Google
In this session, you will hear the story of how a small start-up project in Google Maps ended up mapping the world. You will learn about how Google Geo creates and maintains its basemap data and the process of combining satellite and Streetview imagery, original vector data, algorithms, and a bit of elbow grease to create high quality map tiles. All your questions of how Google maintains map quality in a changing world and freshness of imagery will be answered.
INTERACTIVE EVENT
Google Cardboard Glasses Session
Matt Levey and Rick Boggs - Seaspatial Consulting; CSUMB
Virtual Reality (VR) is one of the hottest topics in computing today. We will introduce participants to this exciting and practical tool using the Google Cardboard platform which consists of a viewer, your modern smartphone, and the Google Cardboard app available on the Google Play Store or Apple’s App Store. Experience Google Earth like you never have before or visit any location in the world accessible through Street View in 360° virtual reality.
POSTER GALLERY AND NETWORKING
Drought Impacts On Land Fallowing In California's Central Valley In 2015
Carolyn Rosevelt, Forrest Melton, Alberto Guzman, Lee Johnson, James Verdin, Prasad Thenkabail, Rick Mueller, Patrick Willis, Jeanine Jones
CSUMB; NASA; USGS; USDA; CDWR.
We present data on monthly and seasonal land fallowing in 2015 in the California Central Valley during the ongoing drought. The datasets were produced using satellite observations as part of a joint effort by NASA, USDA and USGS in collaboration with the CA Department of Water Resources (CDWR) to provide timely and accurate assessments of land fallowing during drought events in California. This effort has used the CA Central Valley as a pilot region for the National Integrated Drought Information System (NIDIS) for the development and testing of an operational monitoring system. The ongoing drought in California substantially reduced surface water supplies for millions of acres of irrigated farmland in California's Central Valley. Rapid assessment of drought impacts on agricultural production can aid water managers in assessing mitigation options, and guide decision making with respect to mitigation of drought impacts. Satellite remote sensing offers an efficient and consistent way to provide quantitative assessments of drought impacts on agricultural production and increases in fallow acreage associated with reductions in surface water supplies. To provide quantitative measures of uncultivated agricultural acreage throughout the year, we developed a decision tree algorithm and applied it to timeseries data from Landsat TM, ETM+, OLI, and MODIS. Our effort has been focused on the development of indicators of drought impacts in the March – Sept. timeframe based on measures of crop development patterns relative to a reference period with average or above average rainfall. To assess the accuracy of the algorithms, monthly ground validation surveys were conducted across 650 fields from March - September in 2014 and 2015. We present the approach along with updated results from the accuracy assessment, and data and maps of land fallowing in the Central Valley in 2015.
Fiction Location & Time Analysis
Marc Gomes
Being both a geographer/GIS person and film buff, I have always been interested in learning about where movies were filmed. To celebrate the 20th anniversary of the movie Pulp Fiction, a friend of mine held a Halloween/costume party based on the film. I figured this party would be a great opportunity (excuse) for me to try investigating the locations where Pulp Fiction was filmed and to create a map of them.
During the research process, I found myself getting deeper and deeper into breaking down the film and its geography. Soon, the mission creep expanded from simply trying to discover the where’s (the movie was filmed) and began to dive into to analyzing time for both the actual locations (Filming Location) and the film’s storyline (Story Location). Along with the wall map, I also produced an accompanying PDF mini map that contains links to view the locations in Google Maps & Street View. The resulting maps are very simple, but the fun is in the data details.
Using ArcGIS Online To Reduce Complexity, Increase Transparency, And Boost Functionality
Bryan Kriete - Santa Cruz County Mosquito & Vector Control
This poster will describe the process of moving GIS users from individual desktop workstations to a centralized portal (ArcGIS Online), and highlight some of the benefits realized from this transition. Integrating a database management system with stand-alone GIS applications is challenging in a multi-user setting. By switching to the online portal format, standards are much easier to set and maintain, users access the same maps and queries, administrators have a clearer understanding of daily operations, and data collection can be accomplished in the field using a specialized set of apps – all of which have increased the productivity and efficiency of our mosquito abatement techniques and procedures.
A free event hosted by CCJDC
Come meet other GIS enthusiasts of all levels and engage in your local geospatial community. Attendees will learn about GIS technology and its applications. Presenters will showcase their work and take home awesome prizes.
All are welcome to participate in this free event!
Detailed information will follow as the event date nears. Subscribe to our newsletter or follow us on twitter to get the latest information delivered directly to you!
Sponsored by: